
Why read this article ?
Ensuring high data quality is essential for organizations aiming to generate business value through analytics and machine learning. Poor data quality, caused by inconsistencies, inaccuracies, or missing information, can undermine strategic decision-making and the effectiveness of data-driven products. When businesses cannot trust their data, they struggle to trust the insights it produces. As the saying goes, “no data is better than bad data” This highlights the critical role of data quality as a pillar of data governance, ensuring reliability, compliance, and overall business success.
a. Lifecycle management of data
When building a data platform, it is crucial to consider six foundational and interconnected layers:
As architectures evolve to support more advanced use cases, additional layers may be introduced based on the specific needs of the data team.
b. data quality dimensions
Dimensions
Various indicators define data quality dimensions, serving as the foundation of modern data quality management programs. These dimensions ensure data integrity and reliability in organizational processes.
The six key dimensions of data quality are: completeness, timeliness, validity, accuracy, consistency and uniqueness.
By prioritizing these dimensions, organizations can improve the quality, reliability, and effectiveness of their data management strategies.
Workflow
Data quality issues should be prioritized according to factors such as business impact and complexity. This approach allows for a more efficient resolution of identified issues. A well-established approach to enhancing data quality is an improvement lifecycle.
The data quality improvement process begins with clearly defining the project scope to establish objectives and focus to ensure continuous monitoring and enhancement of data quality. This workflow consists of five sequential phases: definition, measurement, analysis, improvement, and control, as illustrated in figure 1.
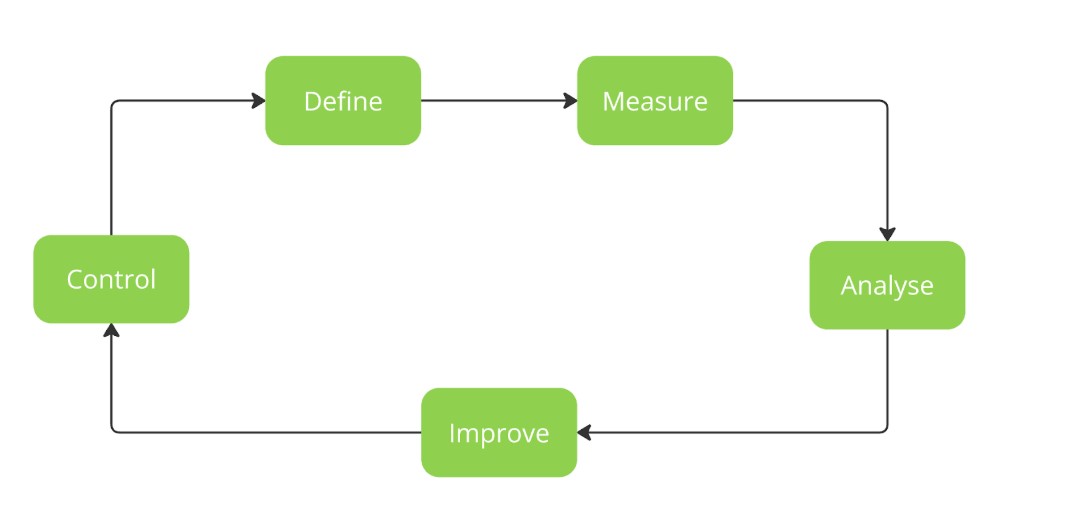
Definition: Define the project scope by selecting relevant datasets and determining necessary attributes.
Measurement: Express data quality dimensions in measurable terms and assess errors. Use metrics to communicate data quality status and track improvements.
Analysis: Identify root causes of data inaccuracies through error clustering and event analysis. Evaluate systemic issues in data entry and processing.
Improvement: Develop and implement solutions to address root causes, such as validation rules and process re-engineering.
Control: Monitor and validate the effectiveness of implemented solutions using control charts and business rules. Ensure continuous improvement by systematically reassessing data quality.
a. Comparative analysis
Several tools are available to ensure data quality in modern data stacks. Here’s a brief comparative analysis of a few key players:
| Soda Max | Monte Carlo | Great Expectations | dbt | |
|---|---|---|---|---|
| Key Features | Data quality checks, monitoring, alerting, anomaly detection | Data observability, anomaly detection, incident management, root cause analysis | Data testing, documentation, and validation, data profiling | Data transformation, testing, and documentation, data governance |
| Integration | Various data sources, APIsata sources, data pipelines | Data warehouses (Snowflake, BigQuery, etc.) | Various data sources, data pipelines | Data warehouses (Snowflake, BigQuery, etc.) |
| Automation | Automated checks, scheduled runs, anomaly alerts | Automated anomaly detection, alerting, incident trackingerlying infrastructure | Automated tests, validation rules, data documentation | Automated tests as part of the transformation workflow |
| Scalability | Scalable to large datasets | Designed for large-scale data environments | Scalable depending on the underlying infrastructure | Scales with the data warehouse |
| Orchestrator Integration | Airflow, Prefect, Dagster | Airflow, Prefect, Dagster | Airflow, Prefect, Dagster | Airflow, Prefect, Dagster |
| How it works | YAML files for configuration | Proprietary | Python configuration files SQL | SQL and YAML files |
| Open Source? | Yes | No | Yes | Yes |
b. Integrating data quality in data pipeline
Integrating data quality into the data pipeline is crucial for ensuring reliable data products. Here’s how these tools can be integrated:
Where to place data quality checks:
Integration with Orchestrators: Tools like Soda, Great Expectations, and dbt can be easily integrated with orchestrators. This allows for automated data quality checks within the pipeline workflow. For example, dbt tests can be part of a dbt job in Airflow, and Soda checks can be triggered as a task within an Airflow DAG.
Automation and Monitoring: Automate data quality checks and continuously monitor data health. Tools can be used to integrate data quality metrics with monitoring systems like Grafana, enabling comprehensive data observability. This can raise alerts and provide dashboard views for monitoring.
Example Workflow: In a typical pipeline:
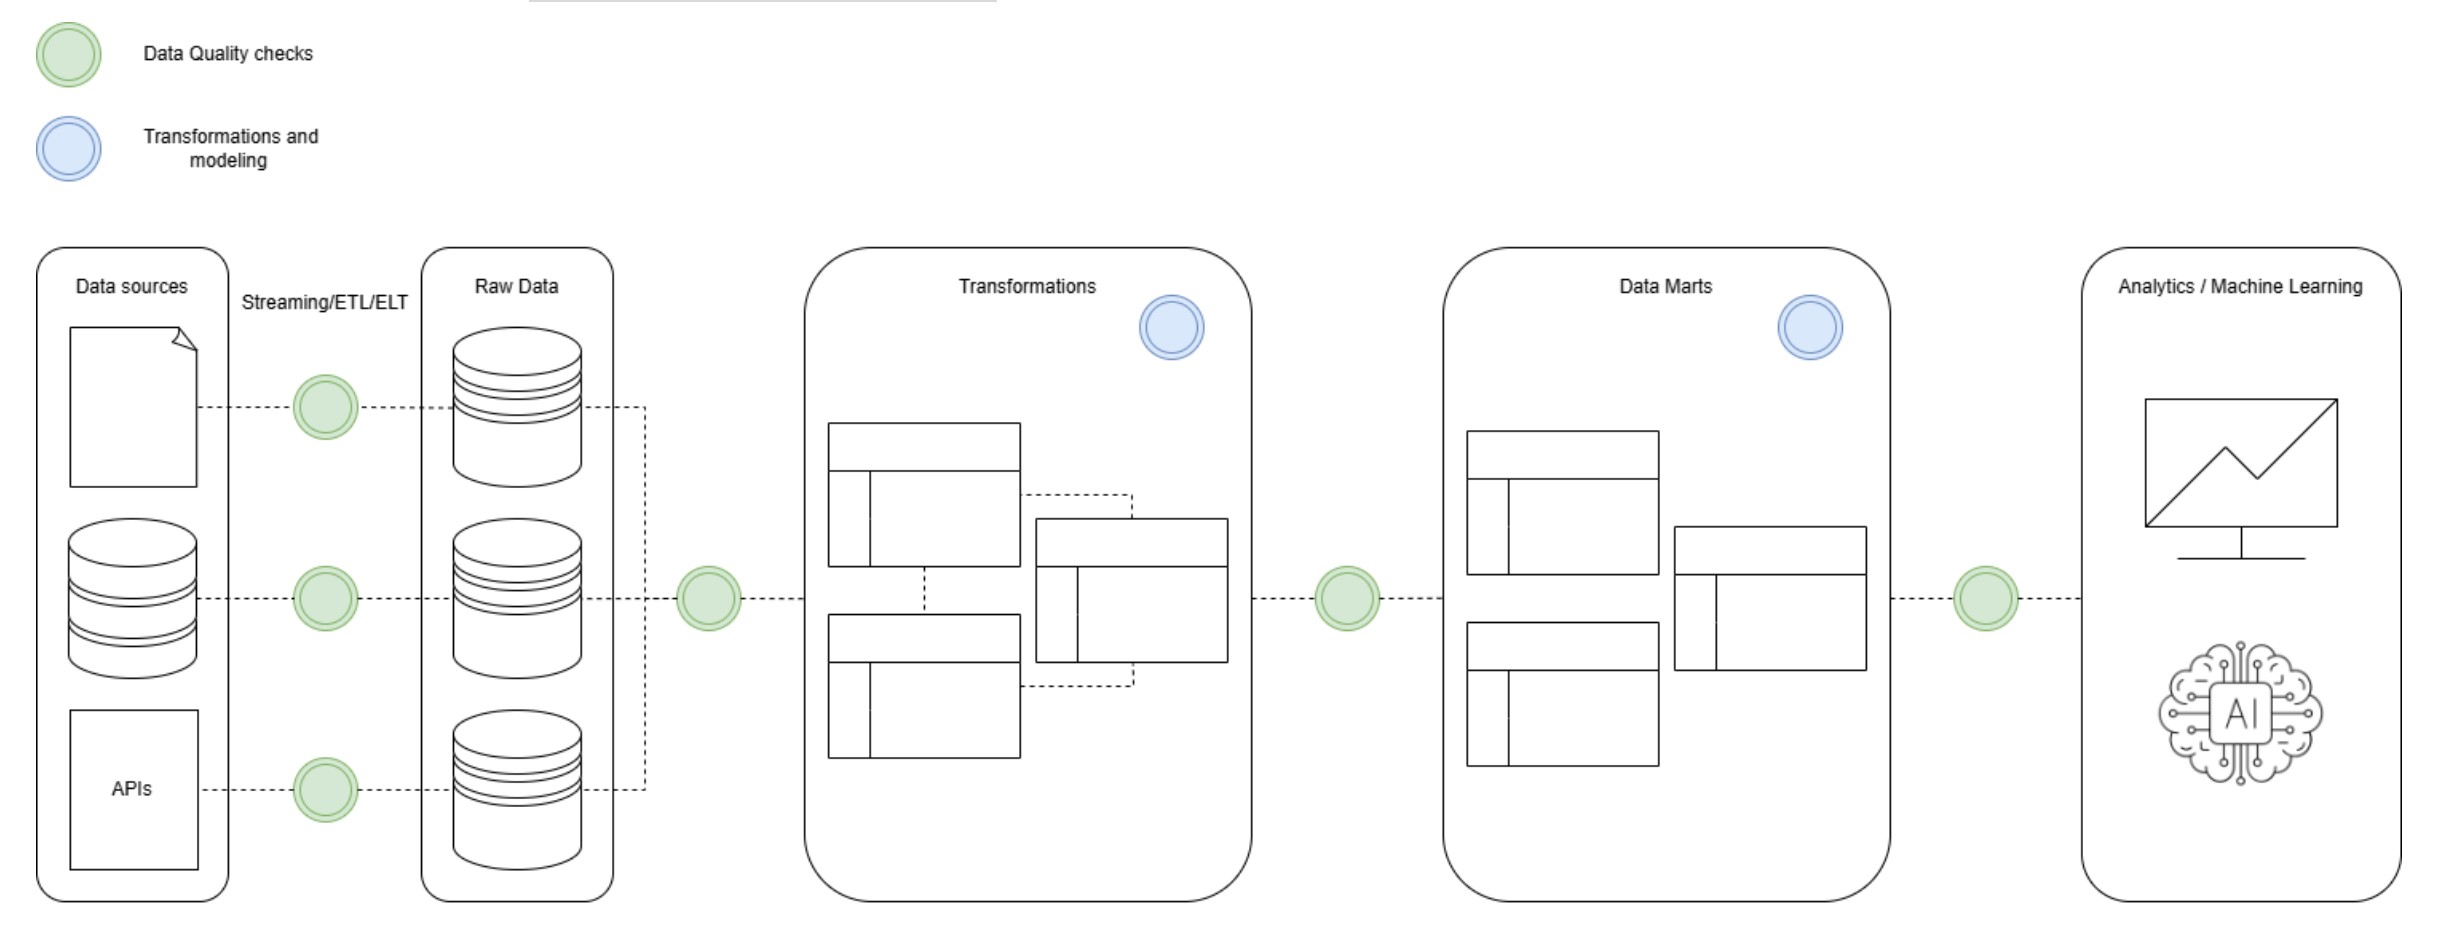
This integration ensures that data quality is maintained throughout the pipeline and that any issues are detected and addressed promptly.
Trustworthy data pipelines and the products they enable are crucial for ensuring that users trust applications to deliver value. Building reliable data is a long-term effort that spans multiple stages of the data pipeline. Moreover, enhancing data quality is not only a technical challenge but also an organizational and cultural commitment.